Line up stock on hand, scheduled demand, and incoming purchase orders by product and day, so you catch a shortfall before it stalls the floor.
On this page
Was this helpful?
Real help from real food people
Chef Diego runs a real food plant. If this page didn't get you there, tell us — a person reads every message.
You've got a heavy cook week on the schedule and a warehouse that's tighter than
you'd like. Before you cut a purchase order or promise a customer a date, you
want one honest picture: for every ingredient, how much is in the building
today, how much the scheduled cooks will burn through, and what's already on a
truck headed your way. The
demand dashboard
lays those three numbers side by side, product by product and day by day, so you
spot the day you run short while there's still time to do something about it.
Kitchen+
What the dashboard lines up
Every row is a product. Every day across the top splits into three reads:
On Hand — the cases you'll have at the start of that day.
Need — how much of the product scheduled production will consume that day.
Arriving — what's due in from purchase orders that day.
On Hand isn't a fixed snapshot — it's a running balance. Bettr starts each
product at today's stock and walks it forward: previous On Hand, minus that
day's Need, plus what's Arriving. So a product that reads comfortable on Monday
can slip below zero by Thursday, and the row shows you the exact day it turns.
When On Hand goes negative, the cell turns red.
The figures read in cases by default. Bettr sizes each product's demand in
pounds first, then converts to cases using that product's
.
Hover any Arriving number to see the purchase orders behind it: the PO, the
vendor, the delivery date, and the cases still owed.
One row per product, one set of On Hand, Need, and Arriving columns per day. The Picking link opens that day's detail.
Read the dashboard
1
Set the date range
Set From and To at the top. The range opens on today through a week
out. From can't be earlier than today — the dashboard looks forward, not
back — and you can stretch To up to a year ahead.
2
Read on hand, need, and arriving
Walk each product's row left to right. A day where Need outruns On Hand plus
Arriving is a day you come up short; the running On Hand turns red the moment
it dips below zero.
3
Switch the view and the units
Toggle Daily and Weekly to zoom between single days and whole weeks —
Weekly totals each product's need across the week. Toggle Cases and LB
to read the same numbers as cases or as pounds.
4
Filter to what you care about
Narrow by product category, or press Negative on hand to keep only the
products projected to run out, or Has arriving to keep only the ones with
stock inbound. The filters stack.
5
Drill into a day
Select the Picking link in any day's header to open that day's picking
detail, where Bettr nets the day's demand against the kitchen's work in
progress to show the cases still left to pull.
On Hand carries across the whole row
Read a product left to right, not one cell at a time. Because On Hand rolls
forward day by day, a green start doesn't mean you're clear — a big Need three
days out can still pull the balance negative. The dashboard's job is to show
you that turn before it happens.
Where Need comes from
Need isn't a number you type. Bettr reads your production schedule, takes each
recipe scheduled for the day, and breaks it down to the raw products it
consumes — following every sub-recipe all the way down — then totals the pounds
per product. Set the schedule over in
Schedule a plan into runs, and the
demand lands here. Nothing on the board for a day means no Need that day.
When forecast fills the far weeks
Bettr only has a firm schedule so far out. Past two weeks from today, it stops
reading production schedules and switches to
:
it projects demand from your open sales orders instead. Those columns are tinted
and tagged Forecast, and a banner tells you forecast is in play.
Forecast is a projection, not a plan
The far columns lean on orders you haven't scheduled to make yet, so treat
them as a heads-up, not a commitment. As those days move inside the two-week
window and you schedule the work, the numbers firm up on their own.
Inside a day's picking detail
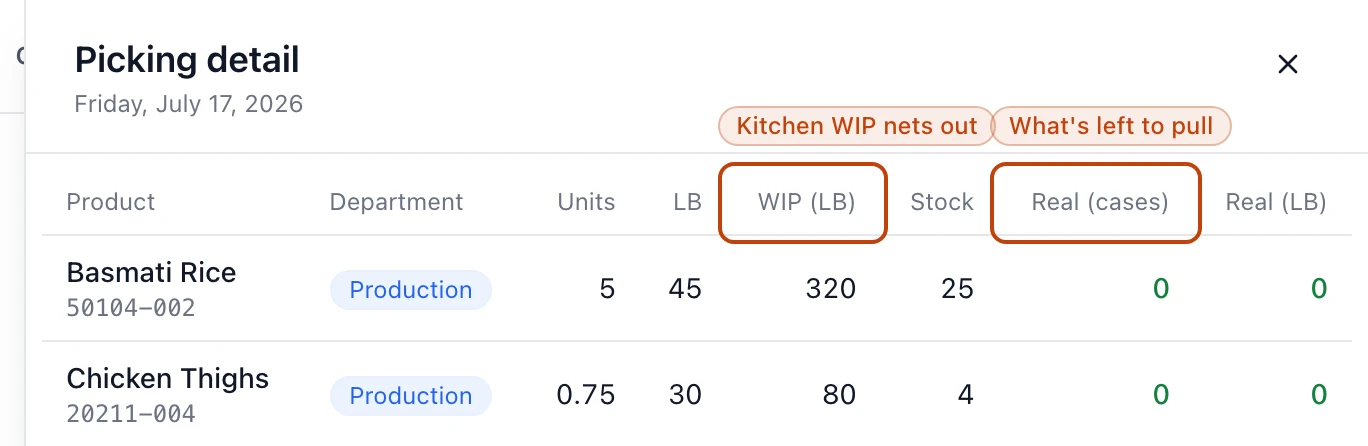
The Picking link on any day opens the picking detail — a panel that turns the
day's demand into the whole cases you'd actually have to pull. It nets each
product's need against the kitchen's
,
and shows the warehouse Stock beside it so you can see whether the warehouse
can cover what's left.
A day's picking detail: each product's demand netted against kitchen WIP, with warehouse Stock shown alongside. Real (cases) and Real (LB) are the cases and pounds left to pull — green when WIP already covers the day, red when it's short.
Rows group by the department that runs them. The Real (cases) and Real
(LB) columns are the payoff: green when the kitchen's WIP already covers the
day, red when you're still short by that amount. This view only reads out the
shortfall — to actually stage the stock, create picking orders in
Pick ingredients for scheduled production.
When the numbers look off
A few banners explain a row that isn't adding up:
Needs configuration — a product with no case weight set. Bettr can't turn
its pounds into cases, so it holds the demand back until you fill in the case
weight on the product.
Zero yield — a scheduled recipe that produces no yield. With nothing to
divide by, Bettr skips its demand rather than guess.
Both are the dashboard being honest about what it can't compute yet, not an
error. Fix the underlying product or recipe and the demand shows up on the next
load.